Simplifying the stock screening process I Weather Reports to help you navigate the flyways in: Futures, Equity Indices, Stocks, Bonds, Commodities, Currencies, Crypto I Disclaimers
Little Bird Trading
Subscribers can skip this section and jump to the paywall line for the latest. Free subscribers and everyone else, please subscribe to ensure you see the latest content when it’s published.
Not a recommendation or endorsement I Not investment advice
Subscribers can skip this section and jump to the paywall line for the latest. Free subscribers and everyone else, please subscribe to ensure you see the latest content when it’s published.
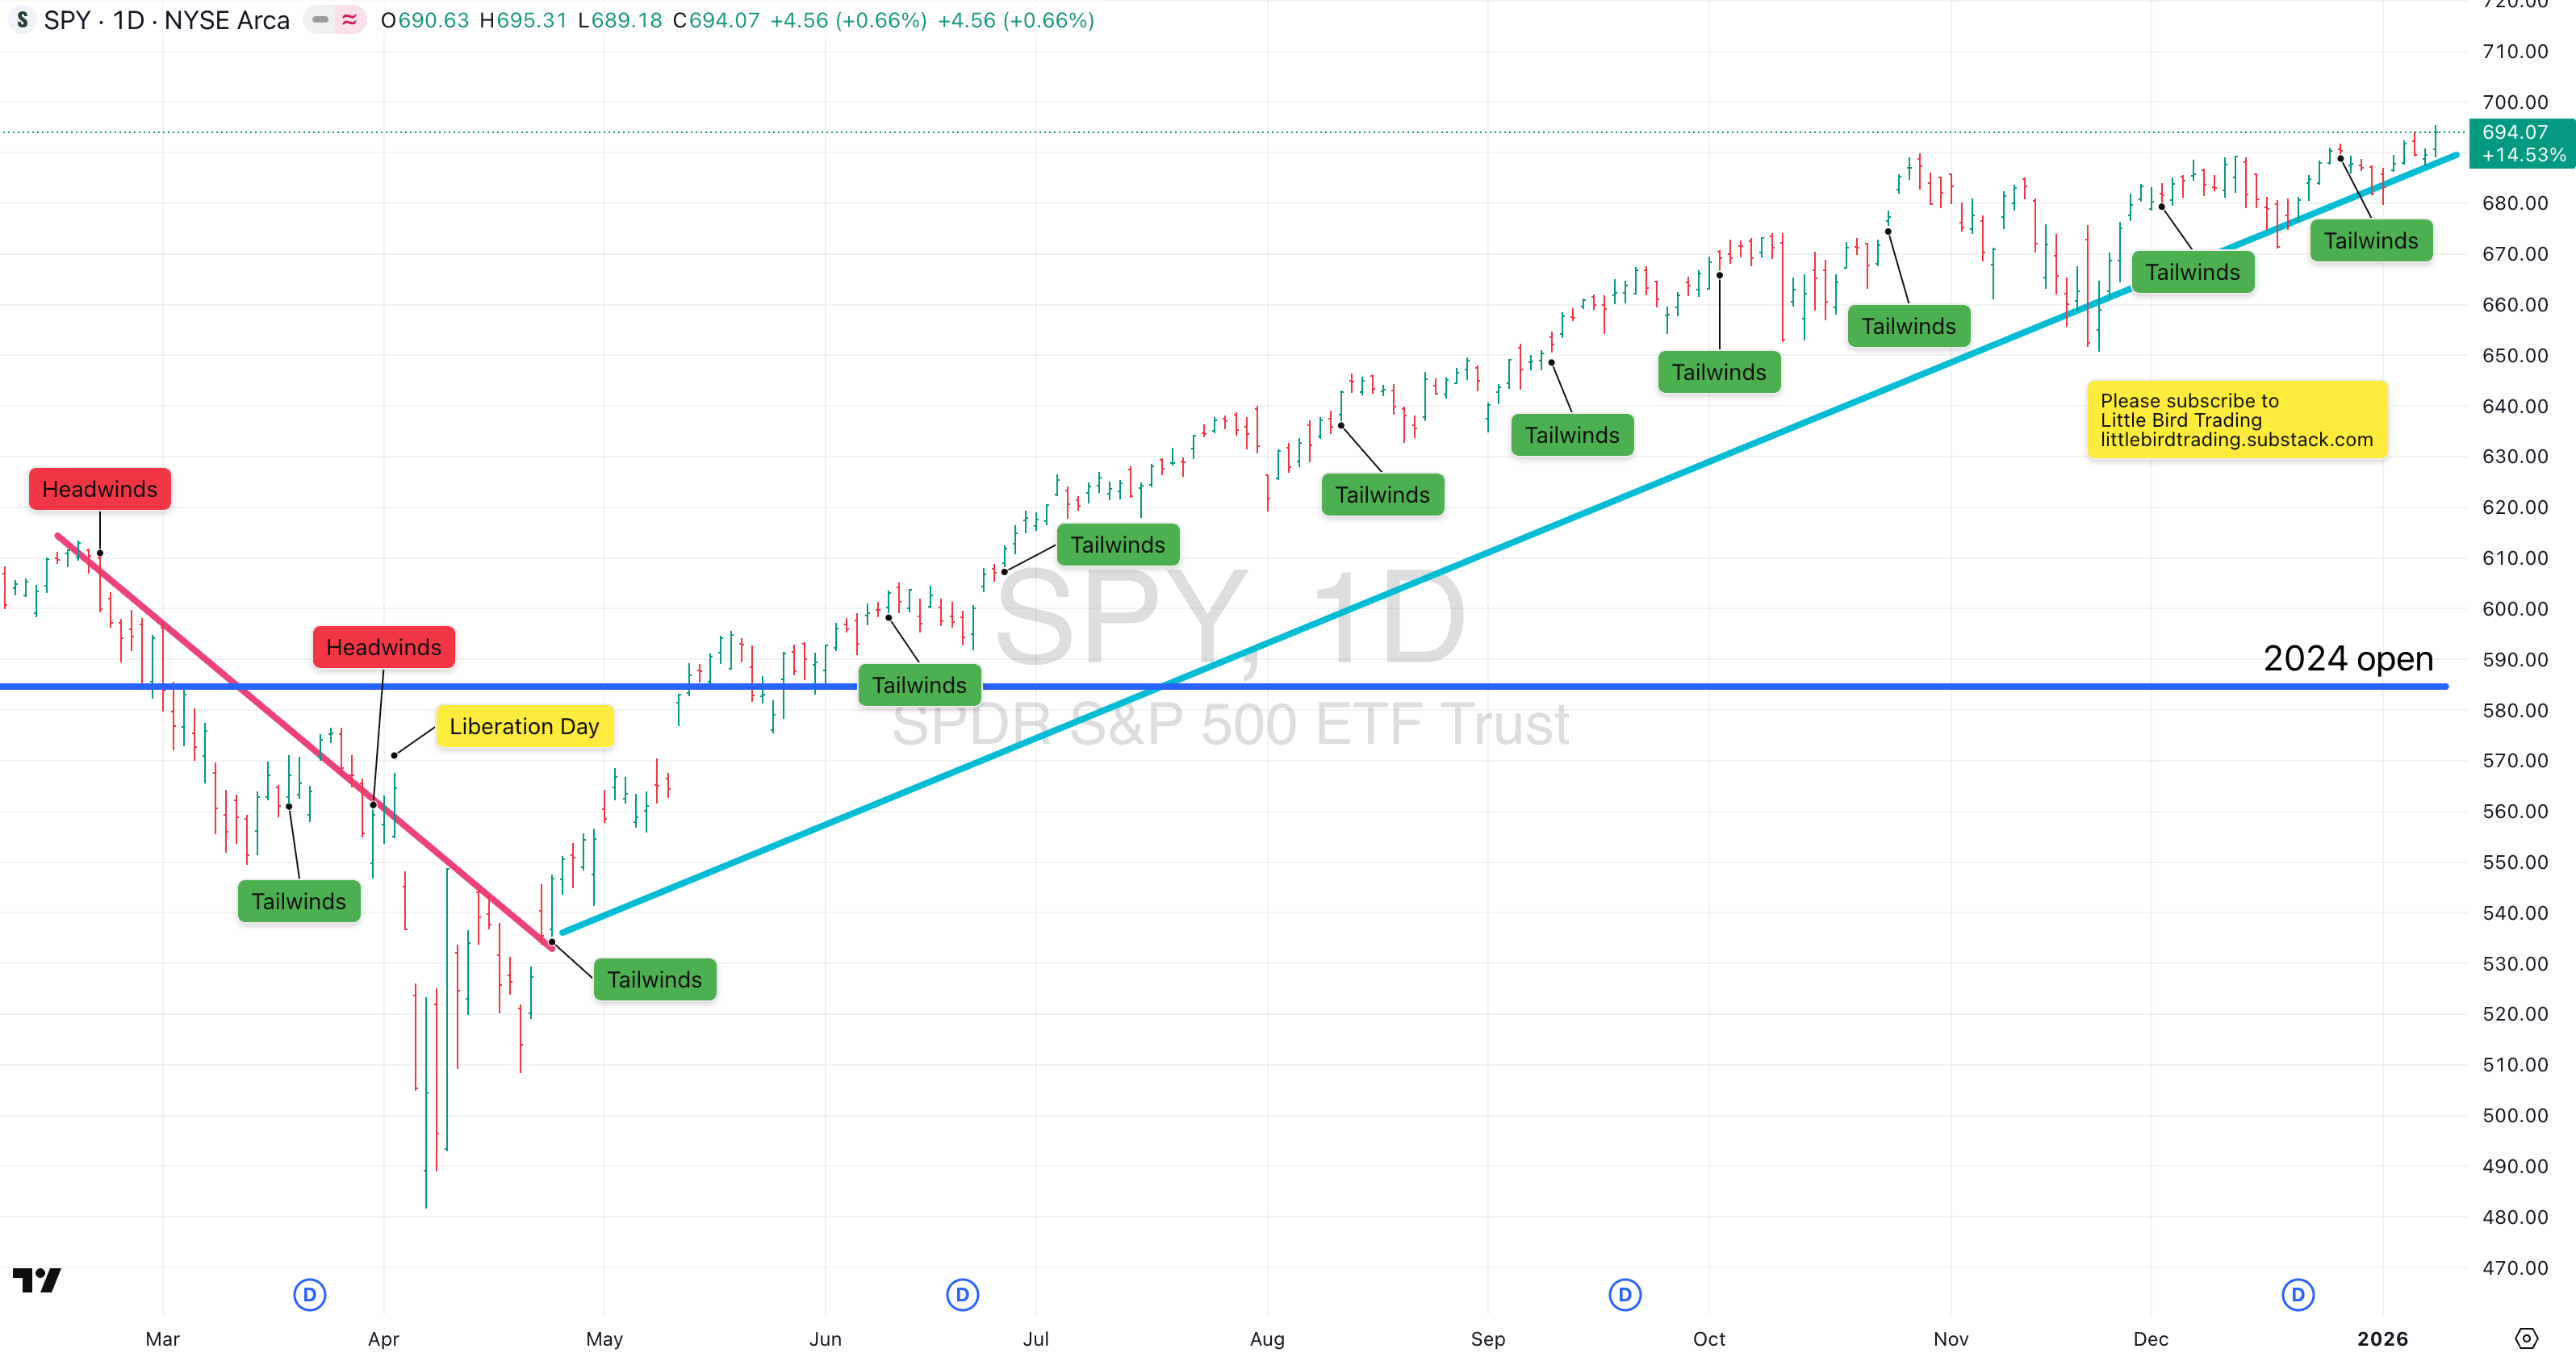
The shorter-term price action continues to build upside momentum, and the longer time-frame uptrend remains intact.
The holidays are all but over, and market participants will be returning to the office to begin positioning for 2026. It’s also an election year (midterms). Until either the short- or long-term trend changes, there’s still plenty more to expect from this bull market.
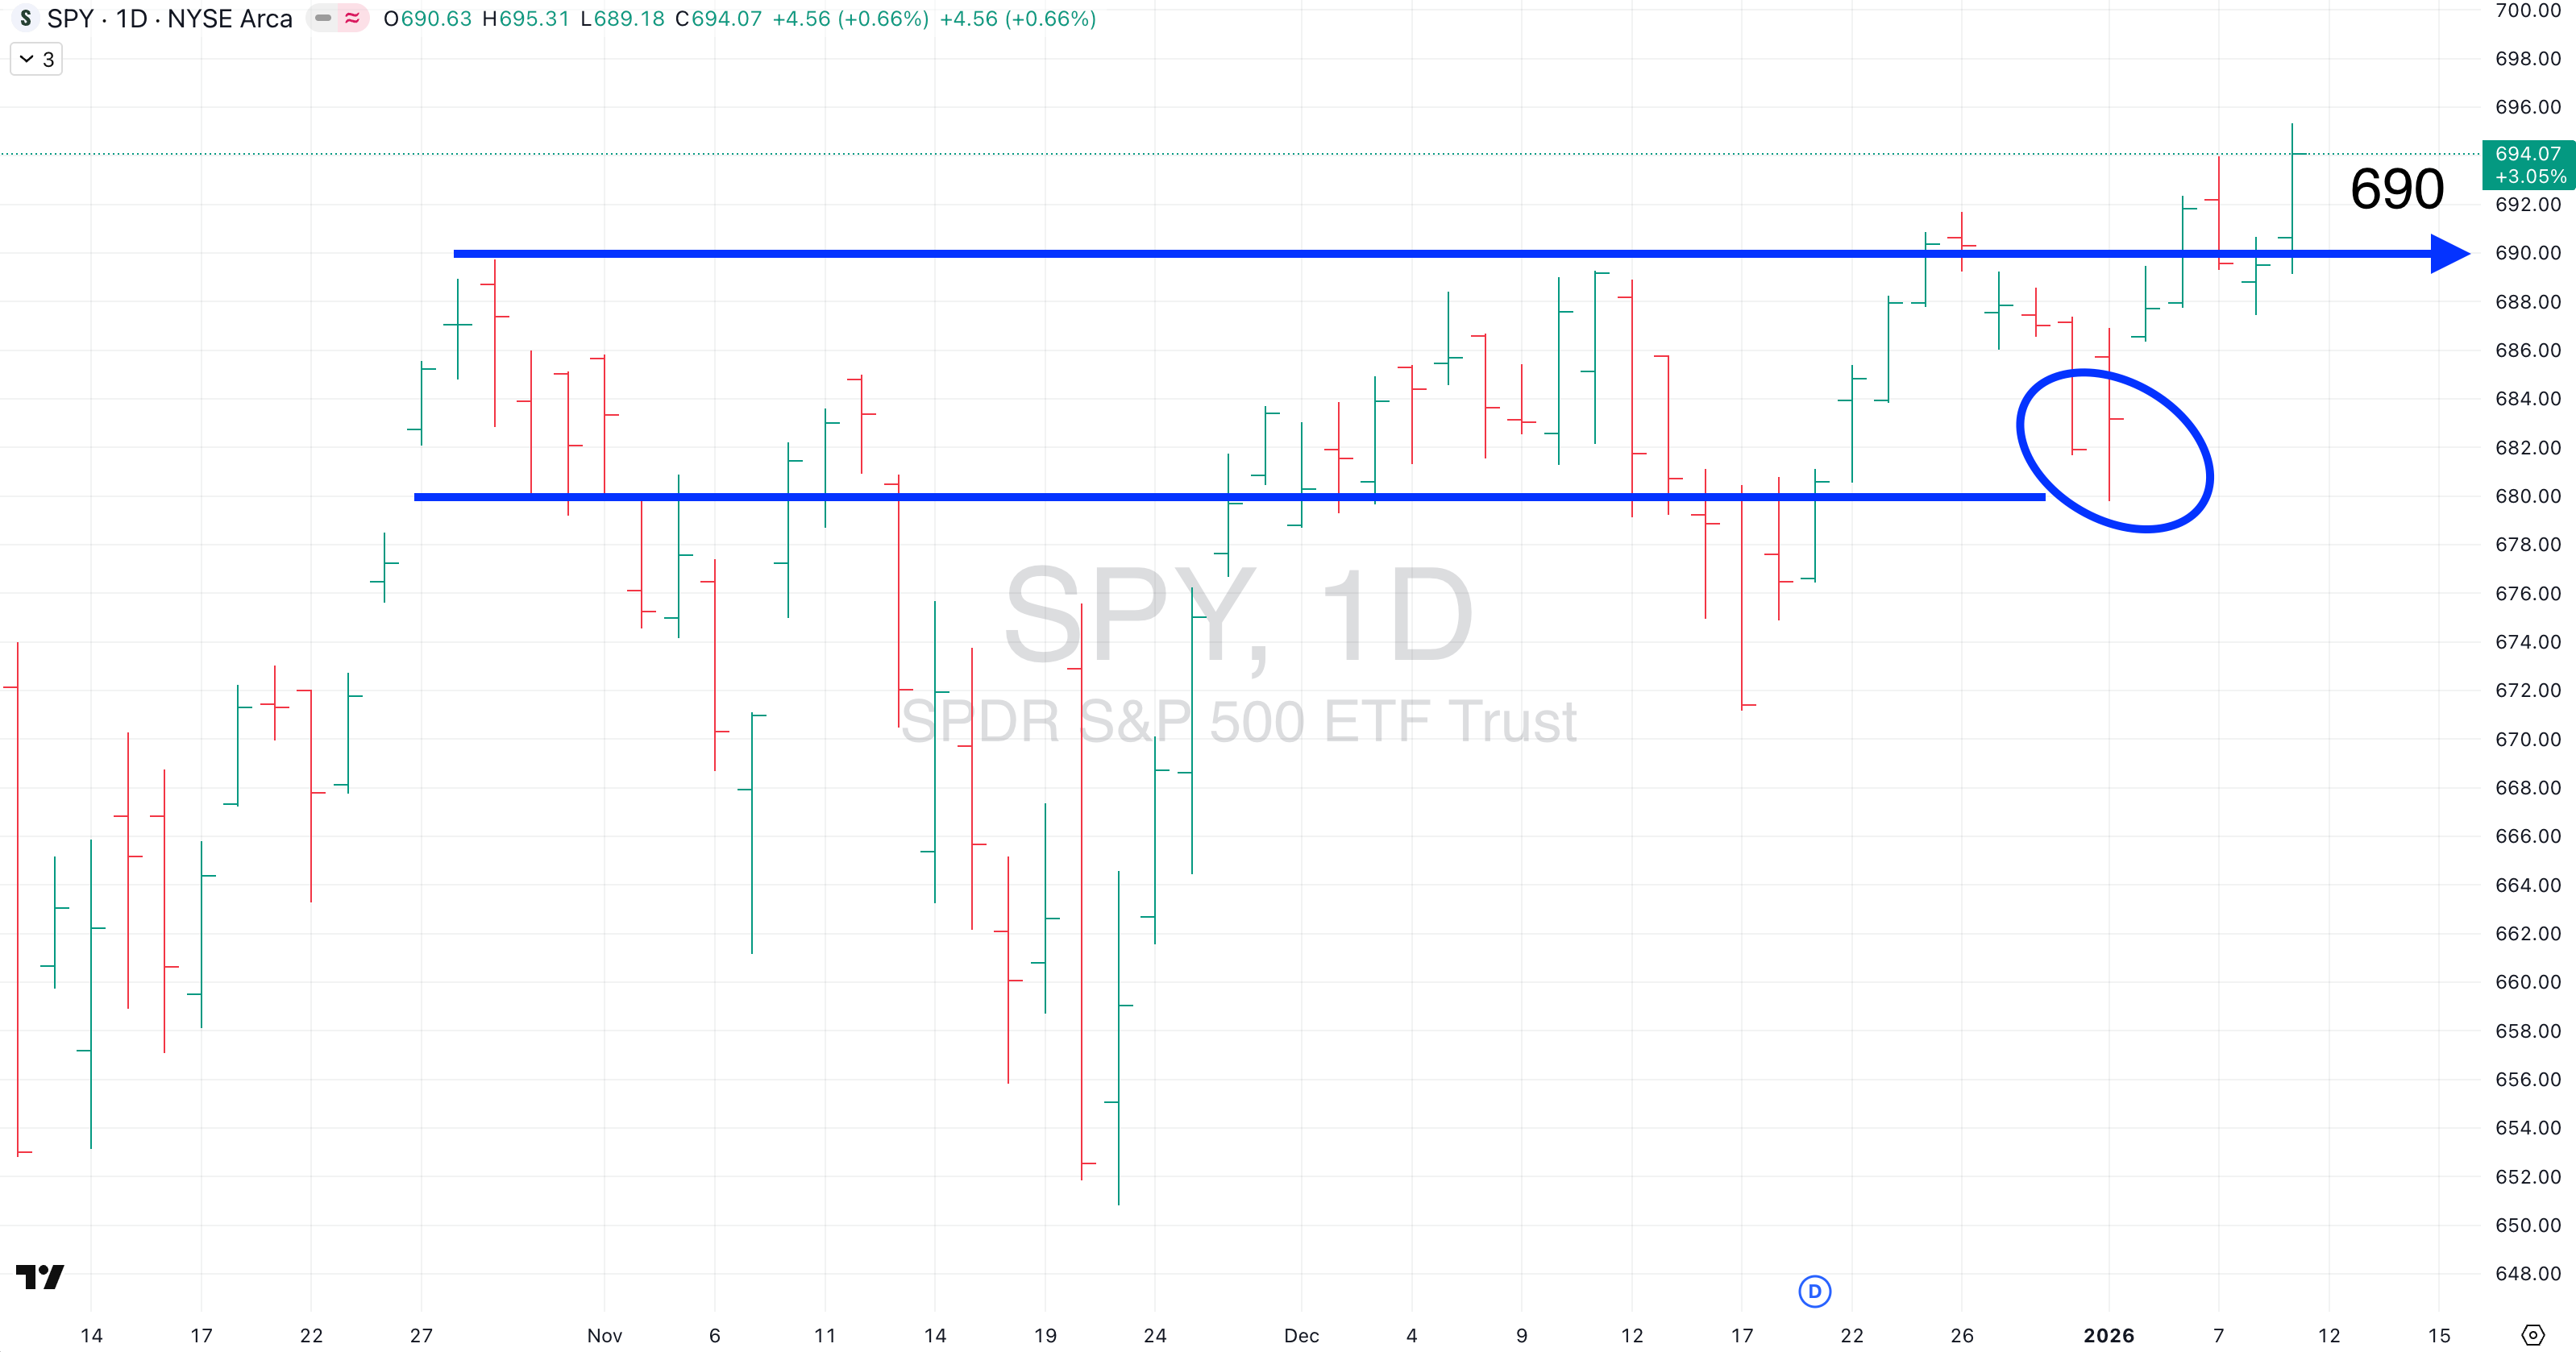
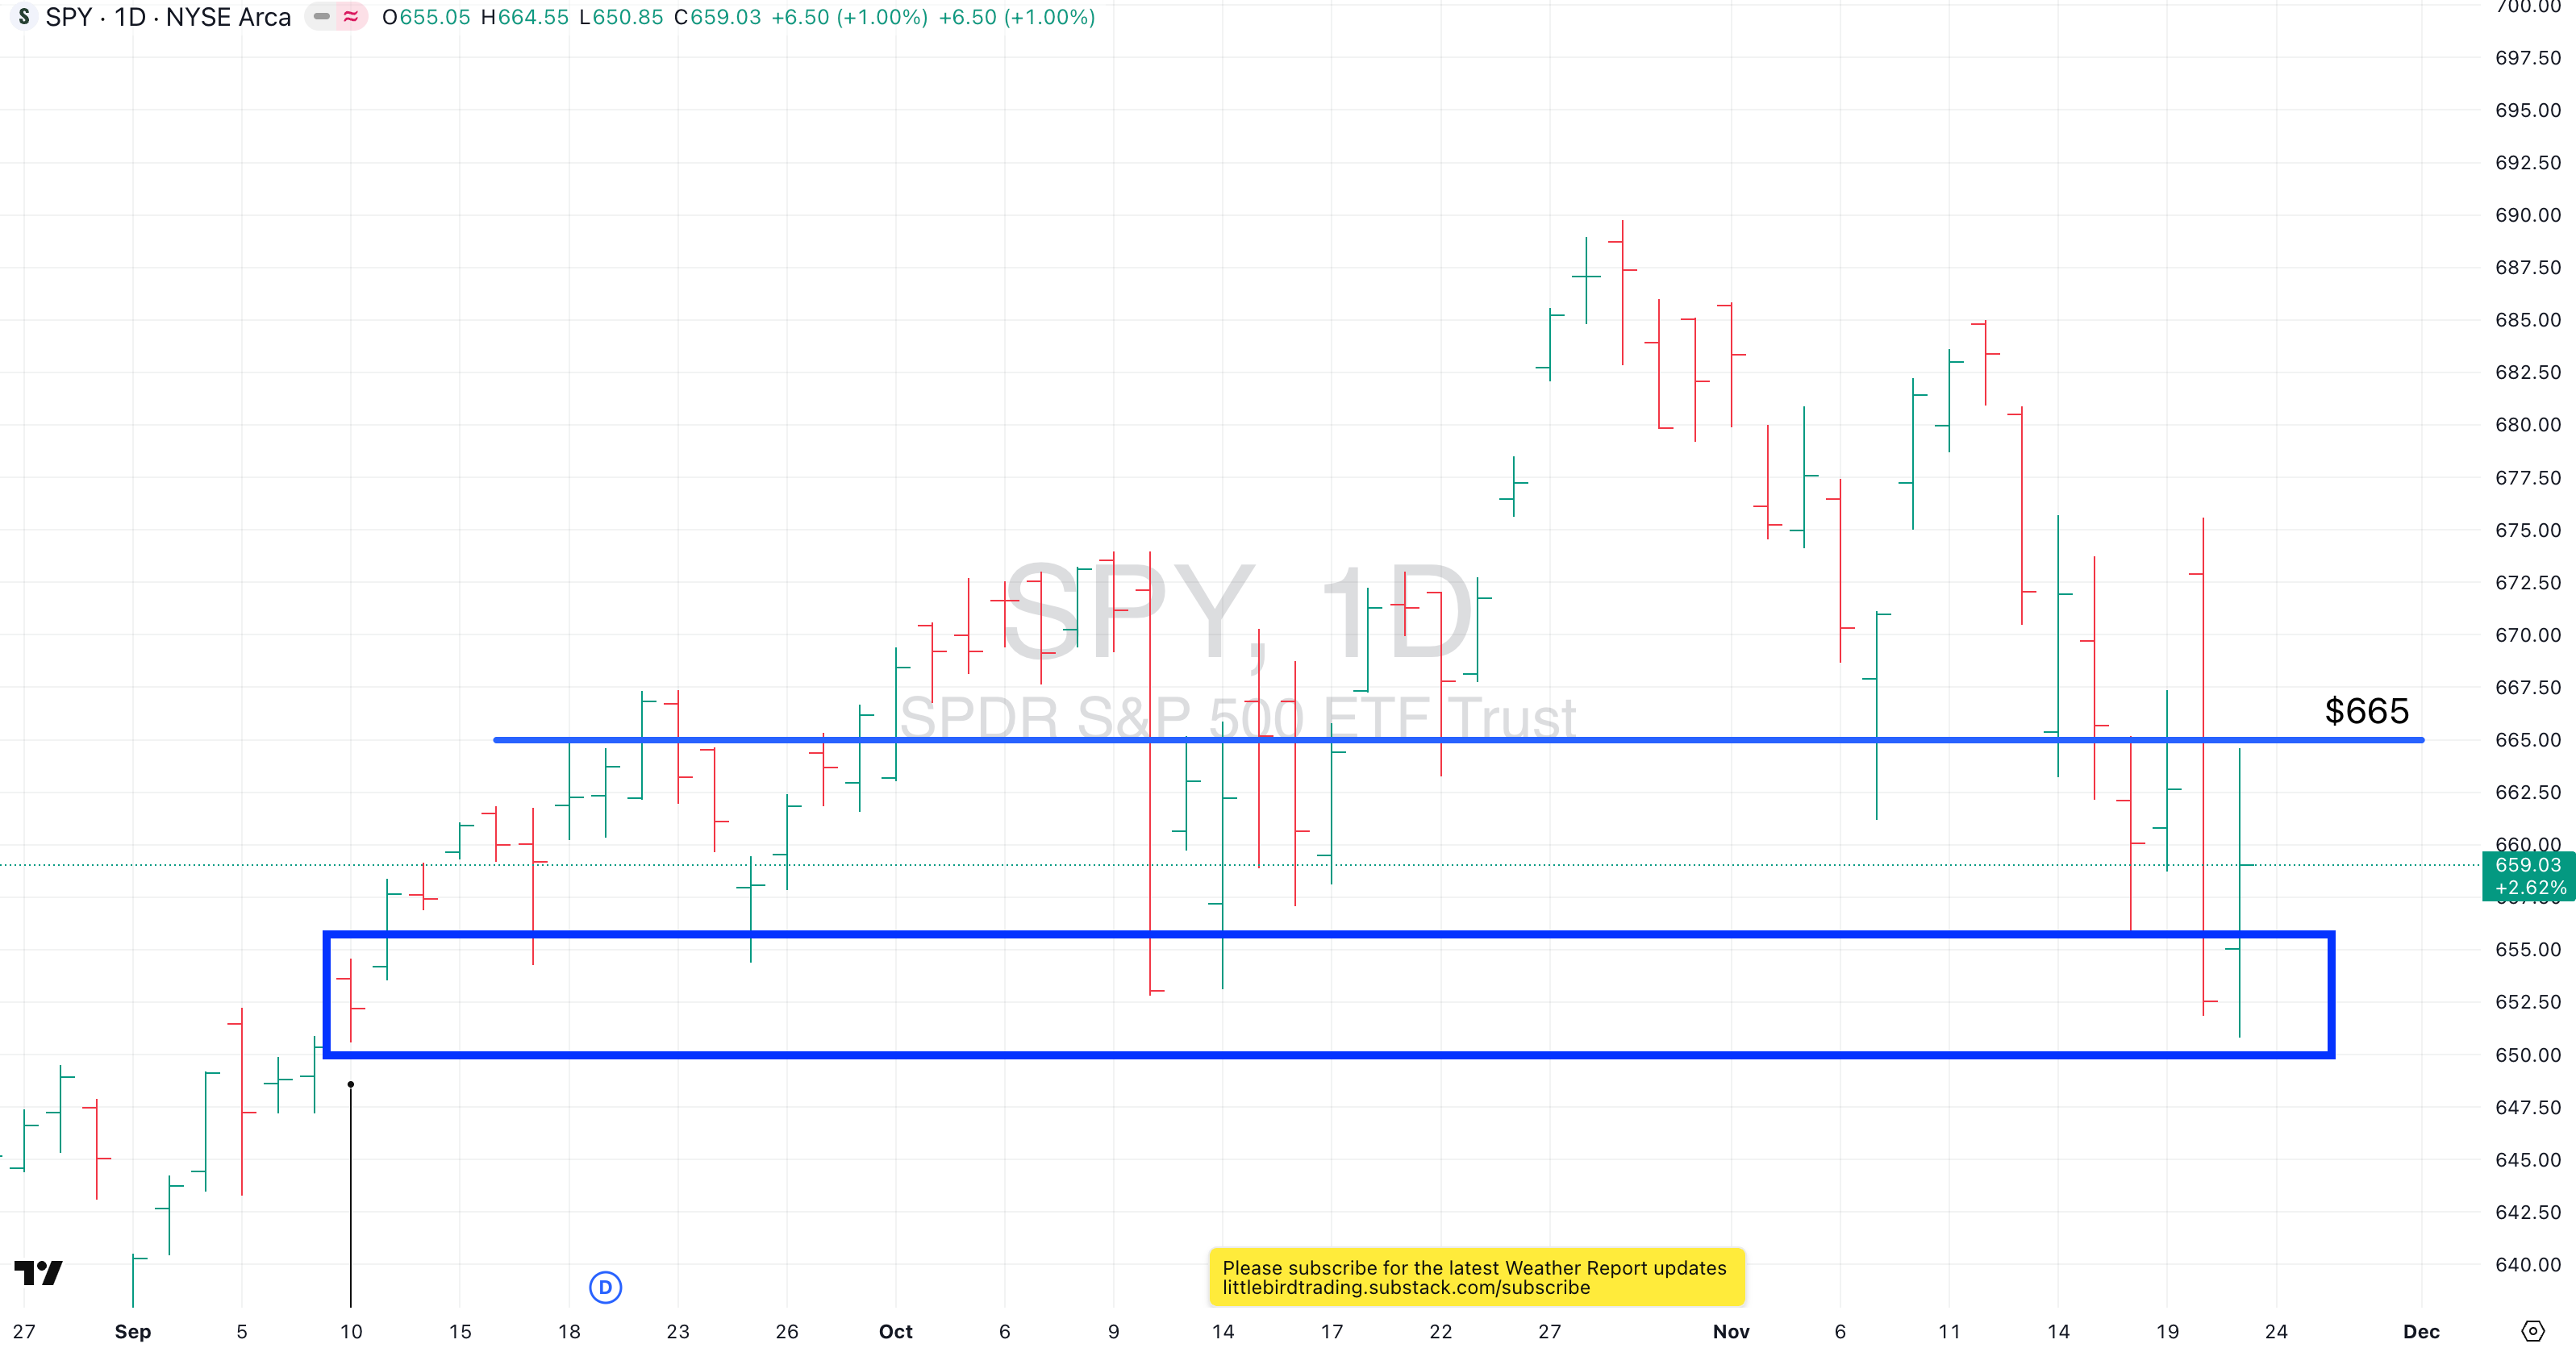
Here’s the latest SPY chart. Was last week the final test of the gap so price can now sustain above 690? My lean is yes, and the support line has moved up to the top of the gap around 682.
Here are charts of the other Big 4 indices:
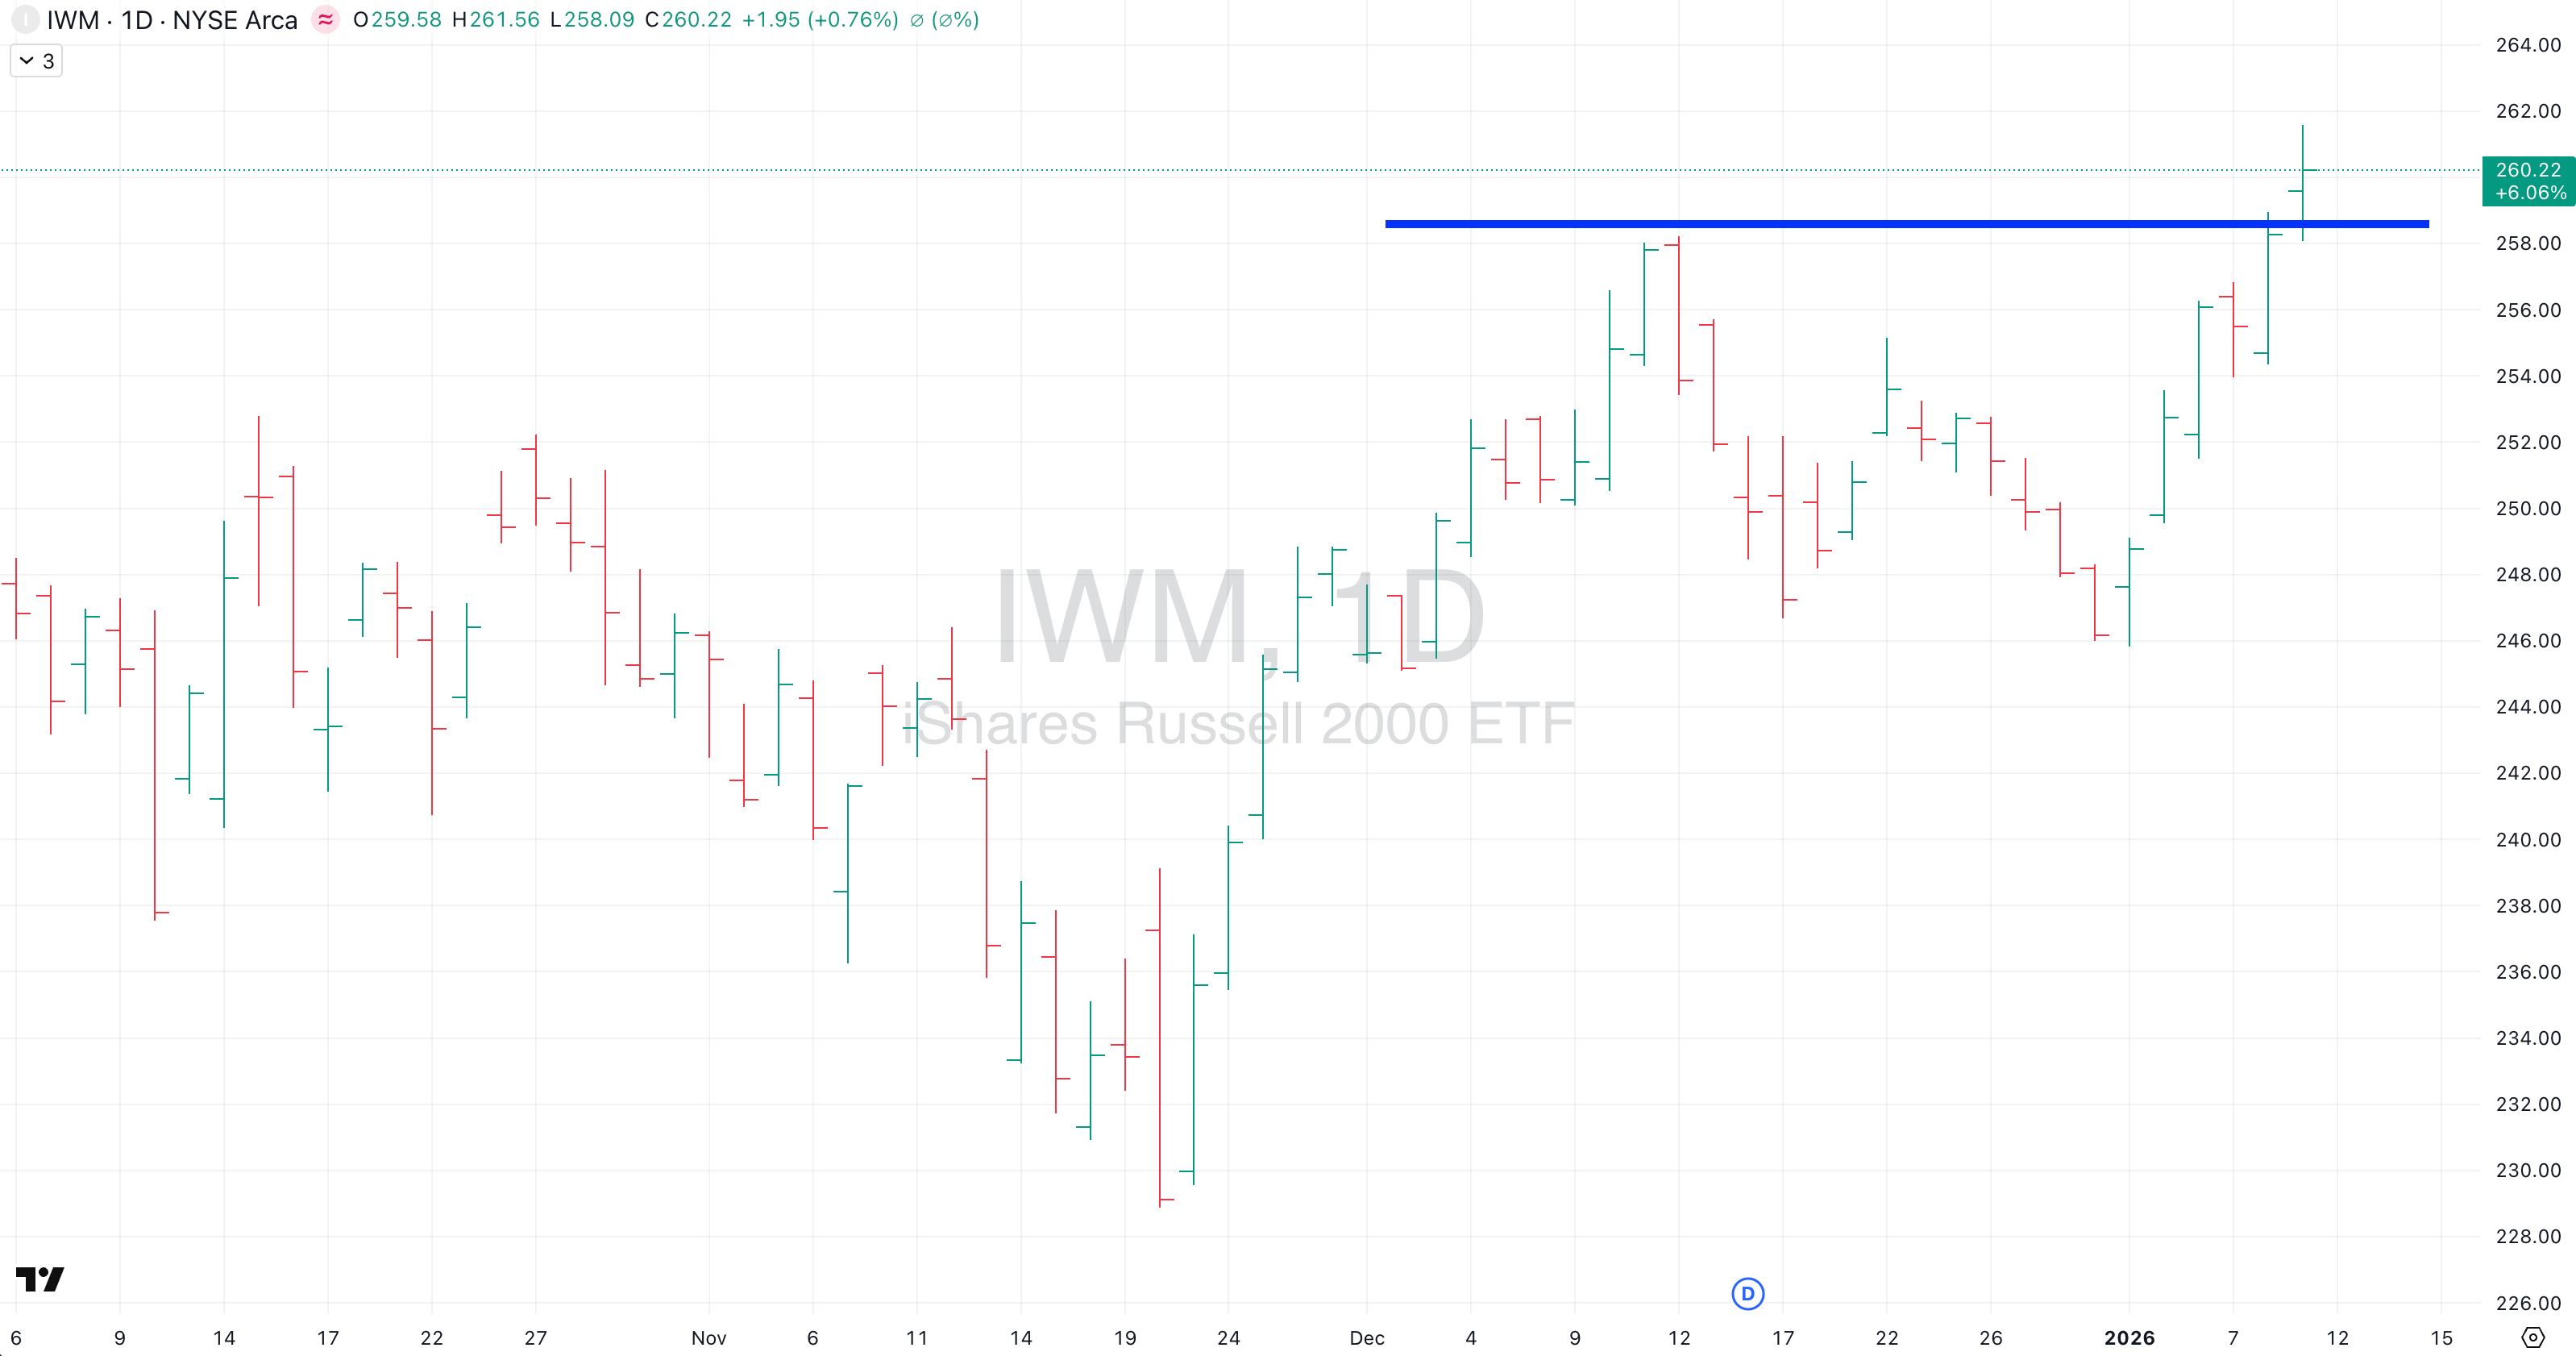
IWM - Small Caps
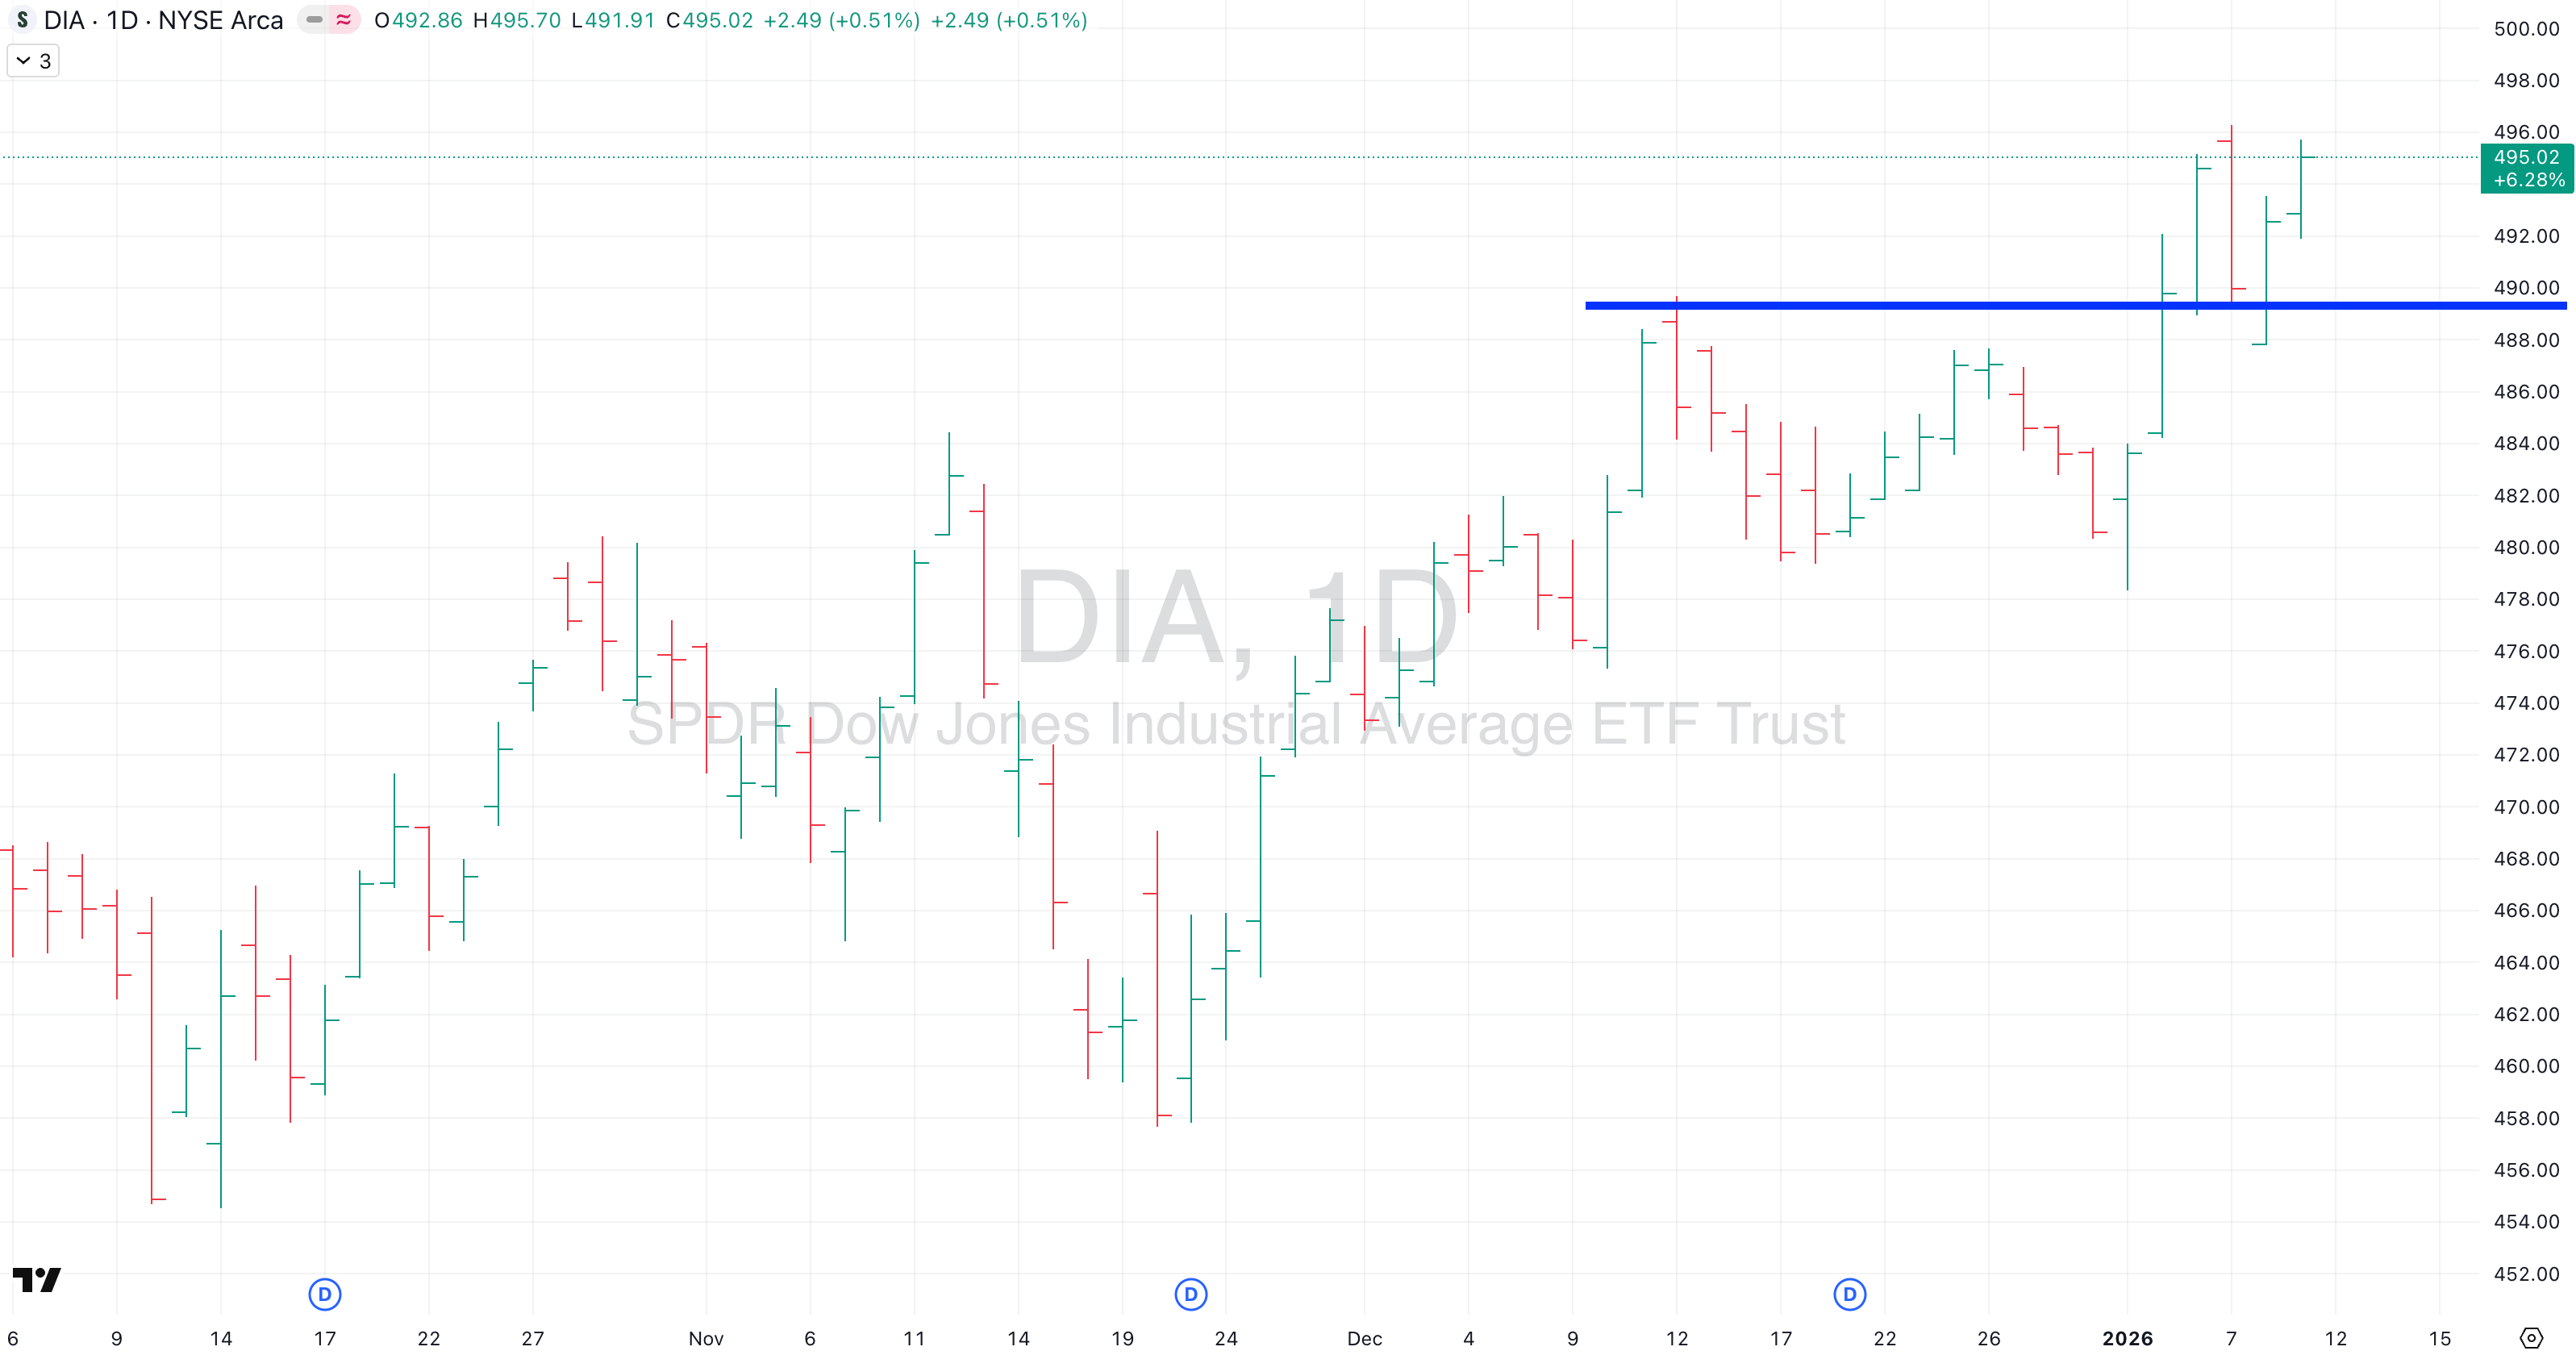
DIA - Dow Jones
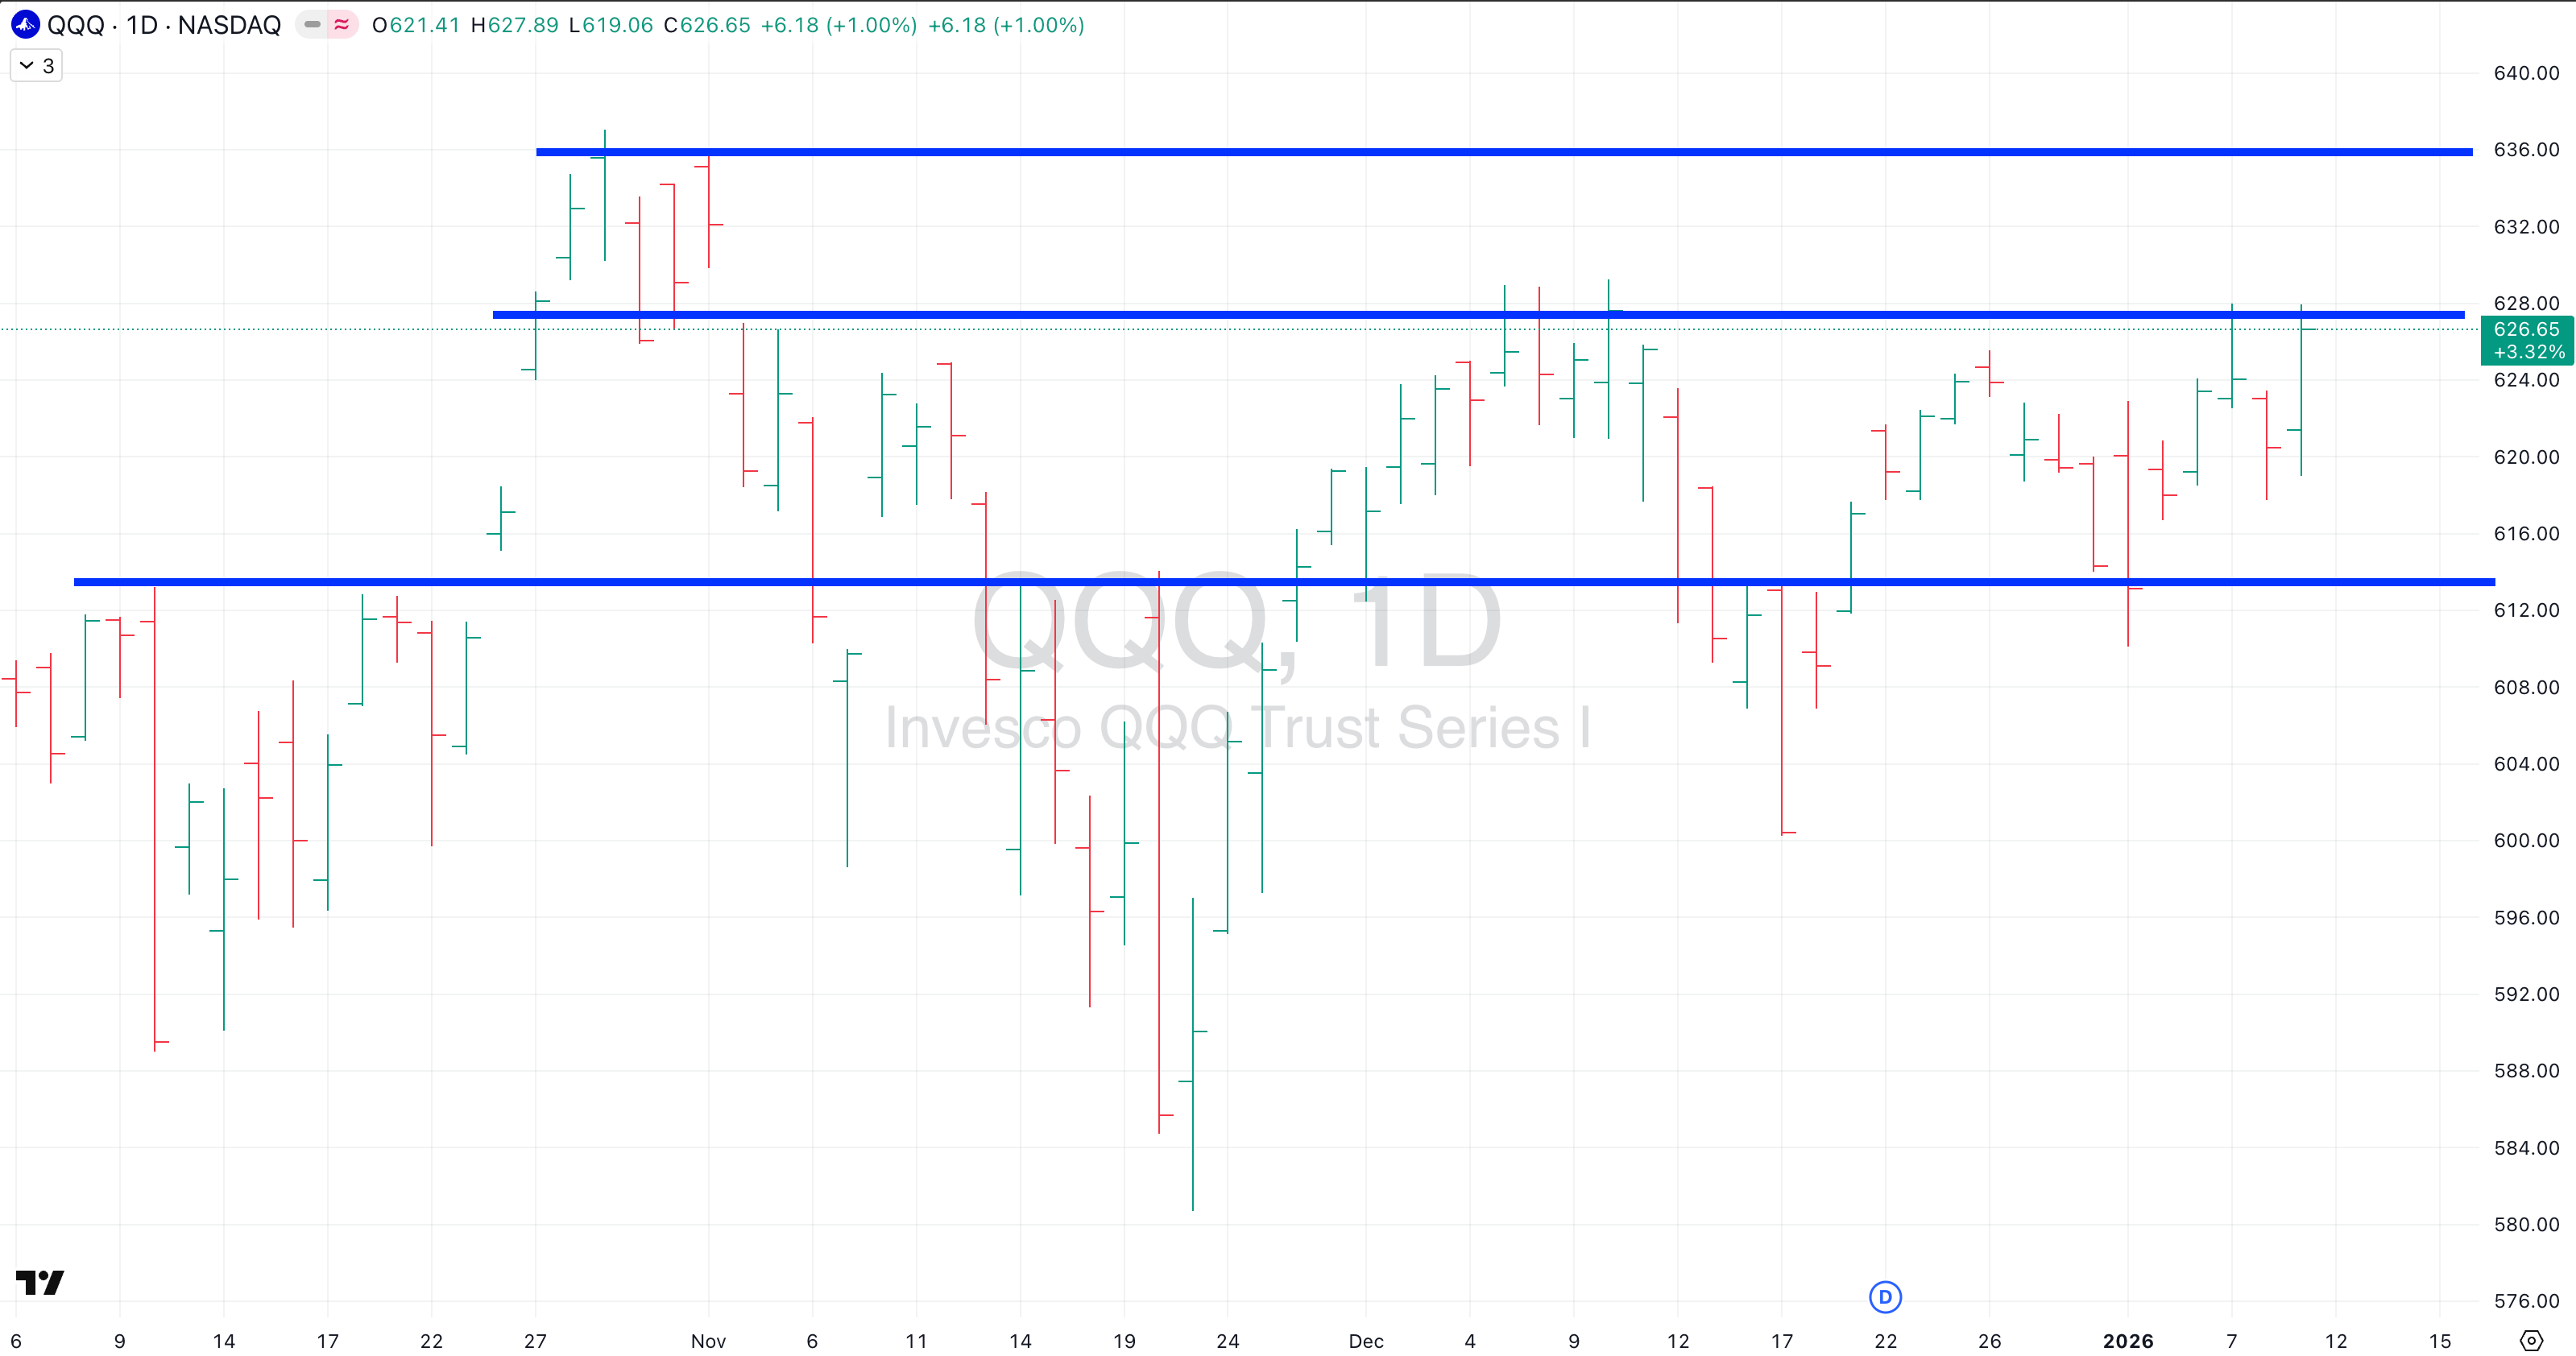
One is not like the other three- QQQ Nasdaq:
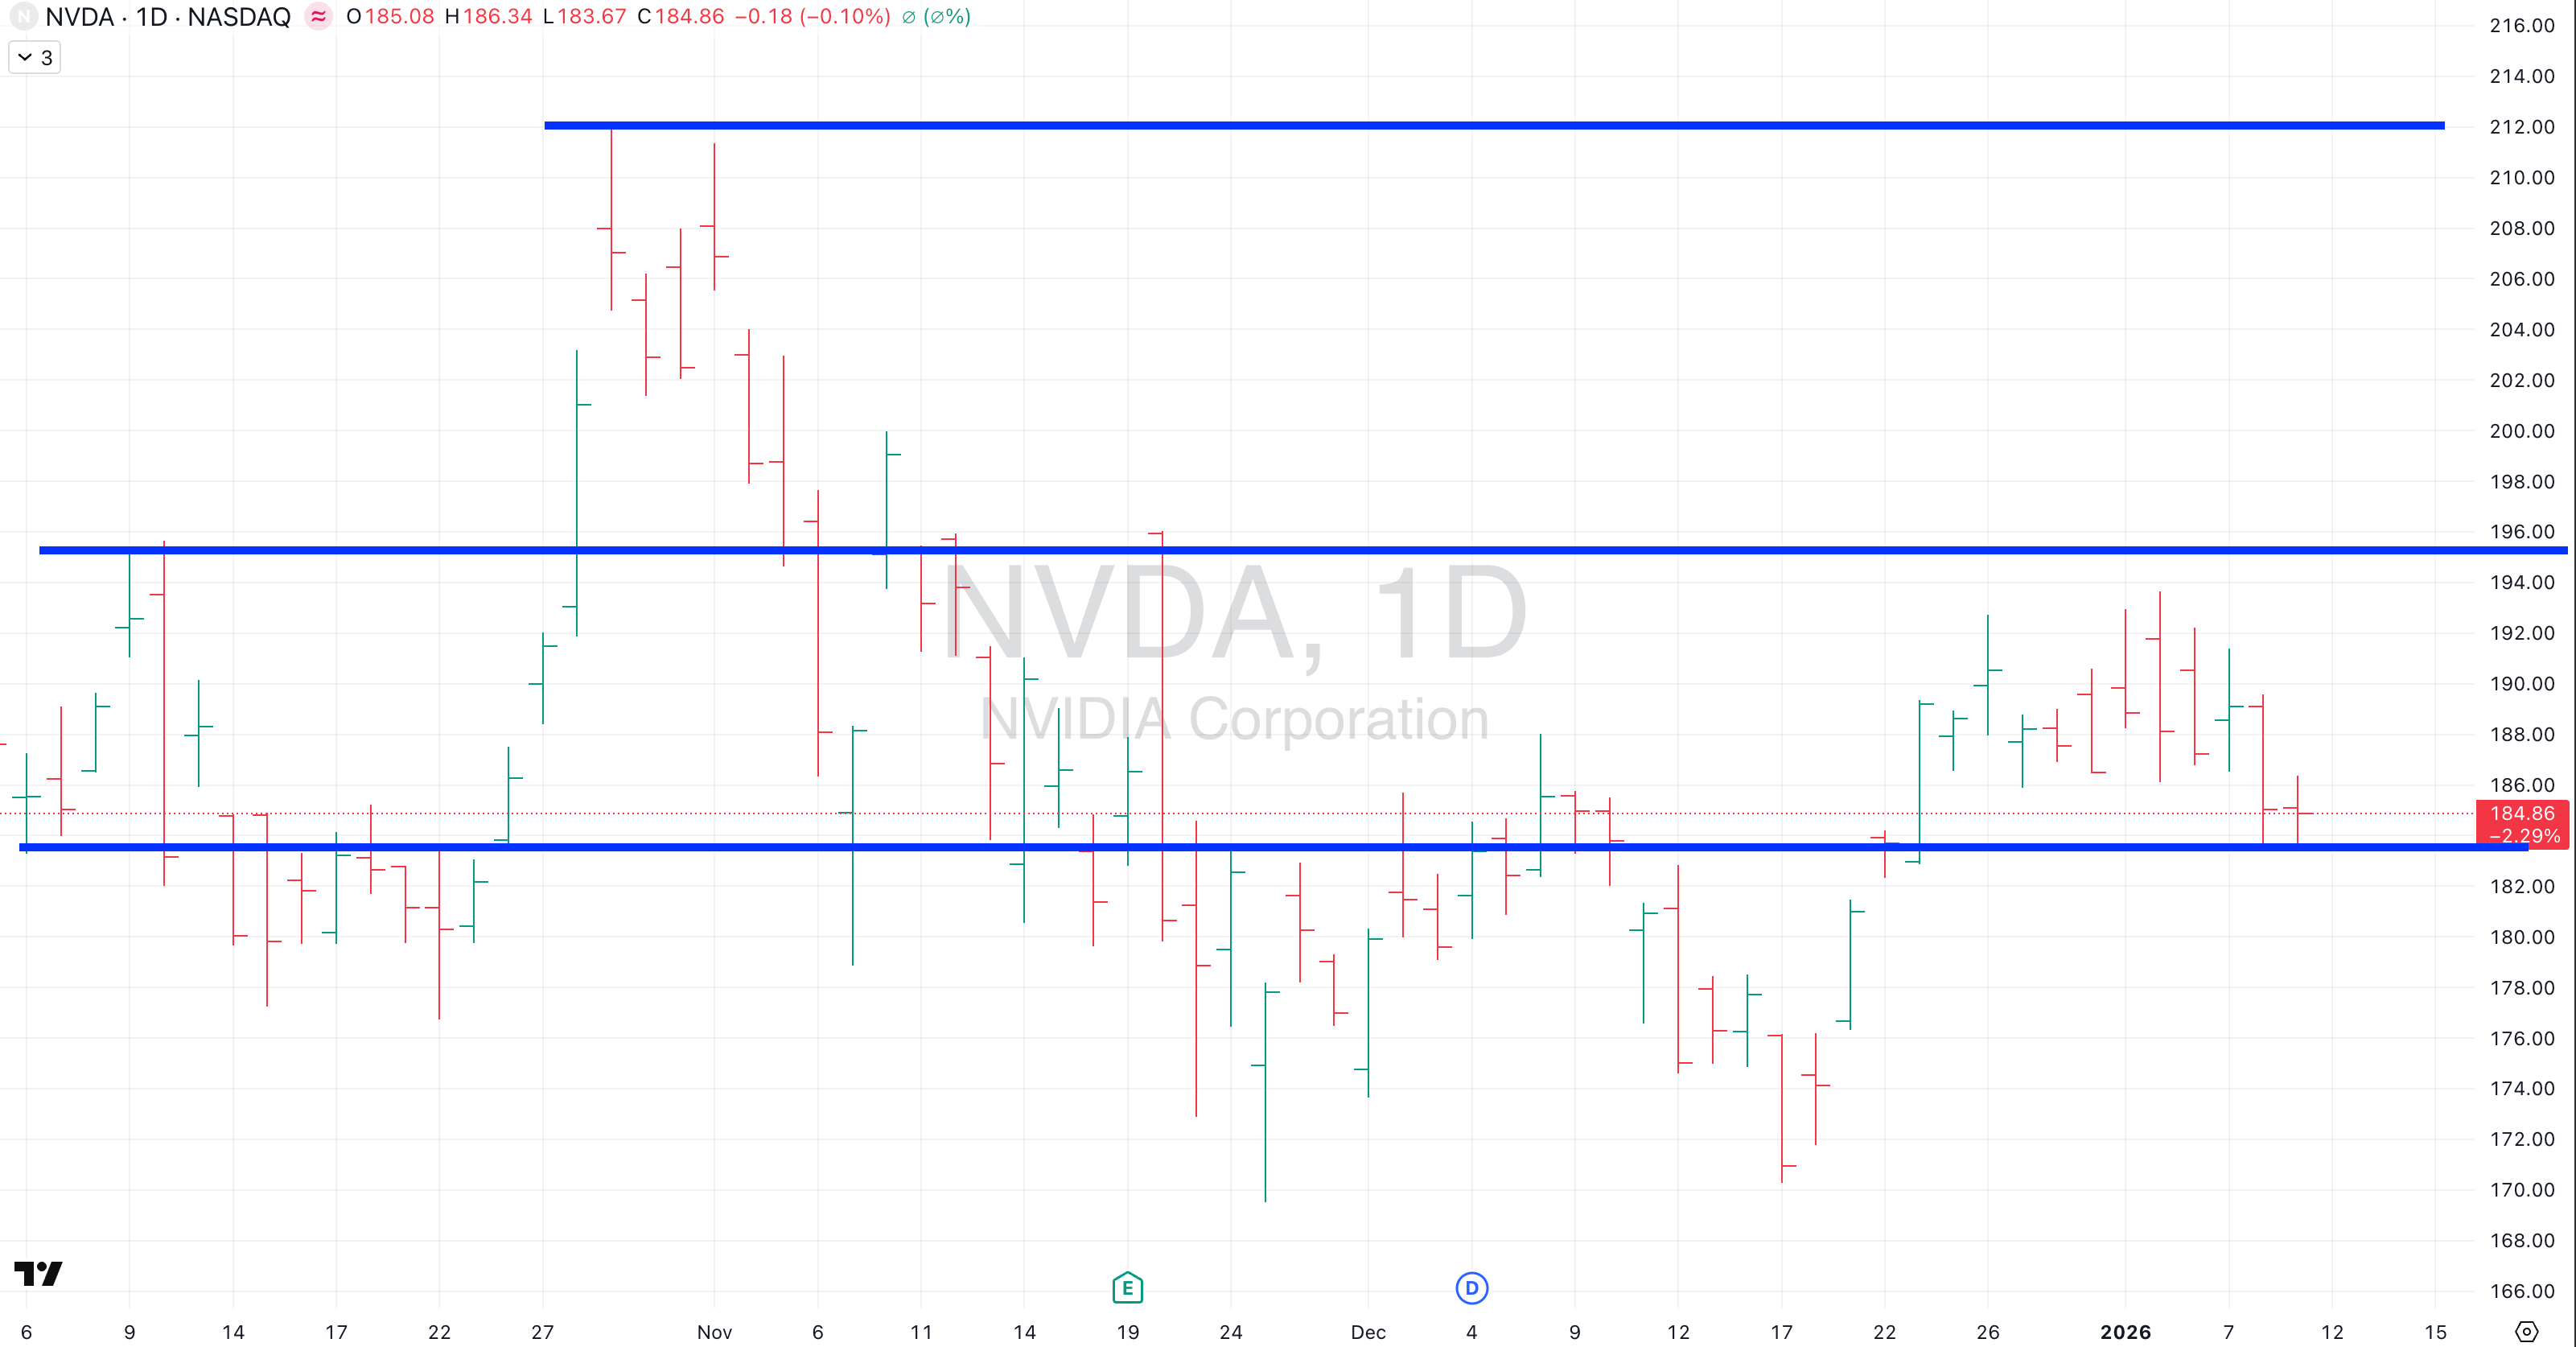
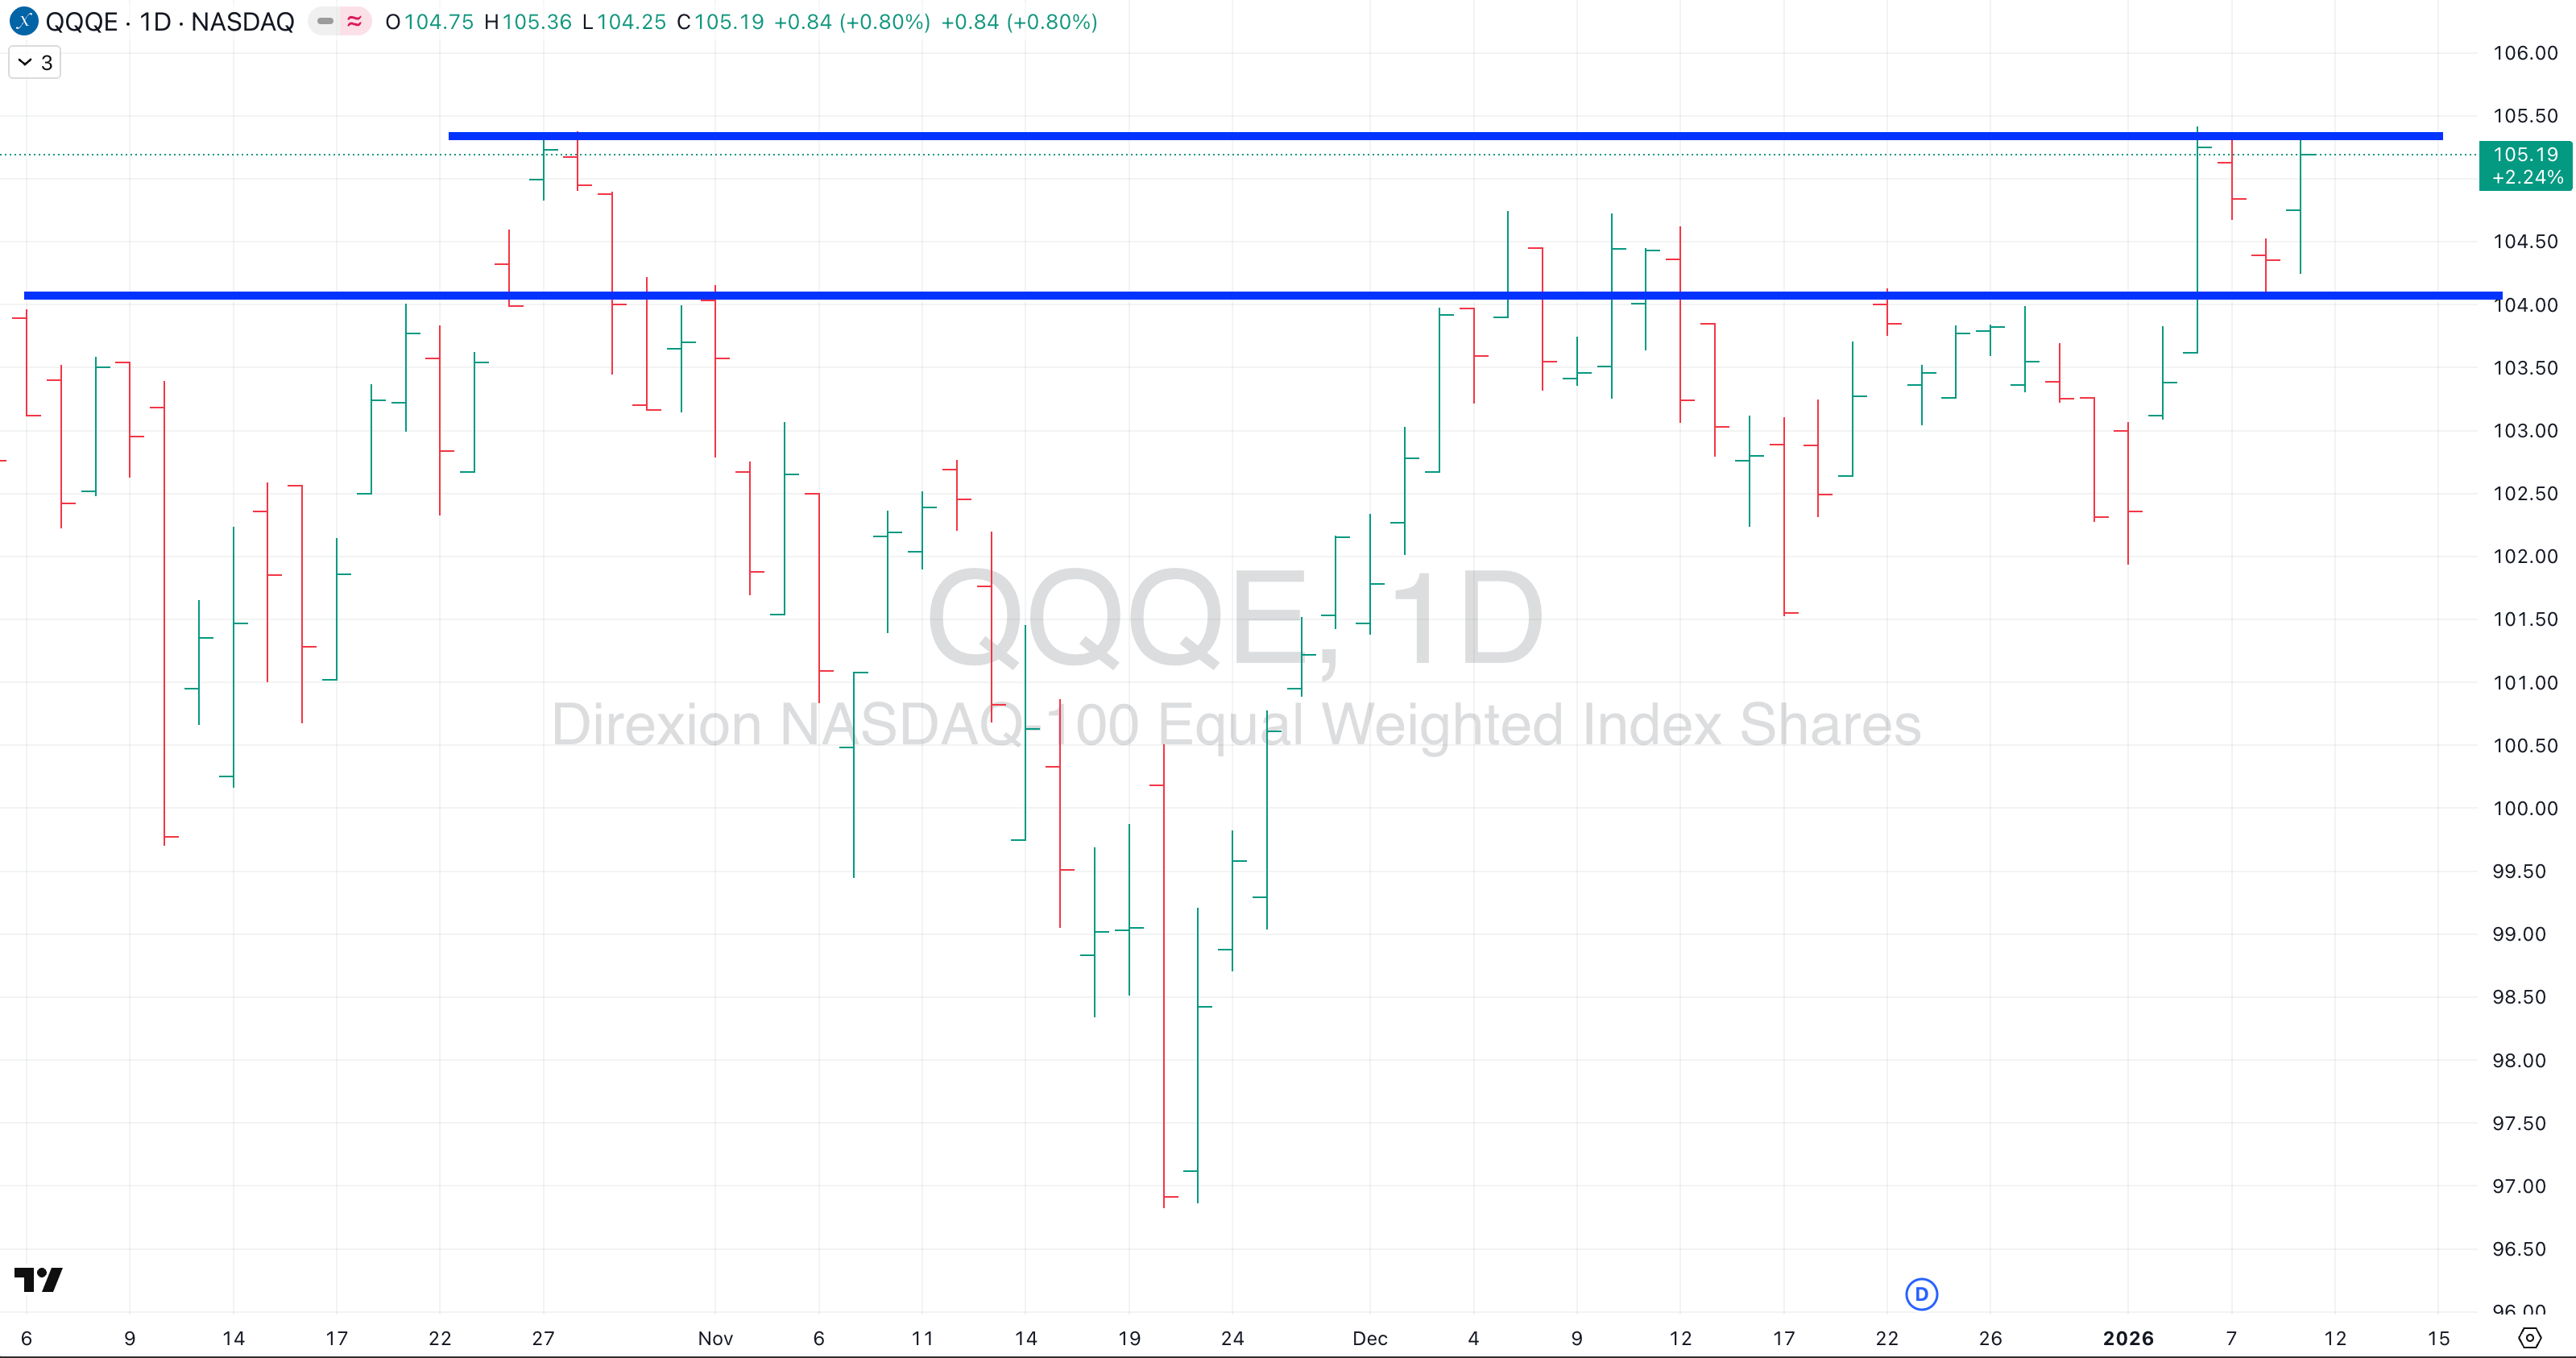
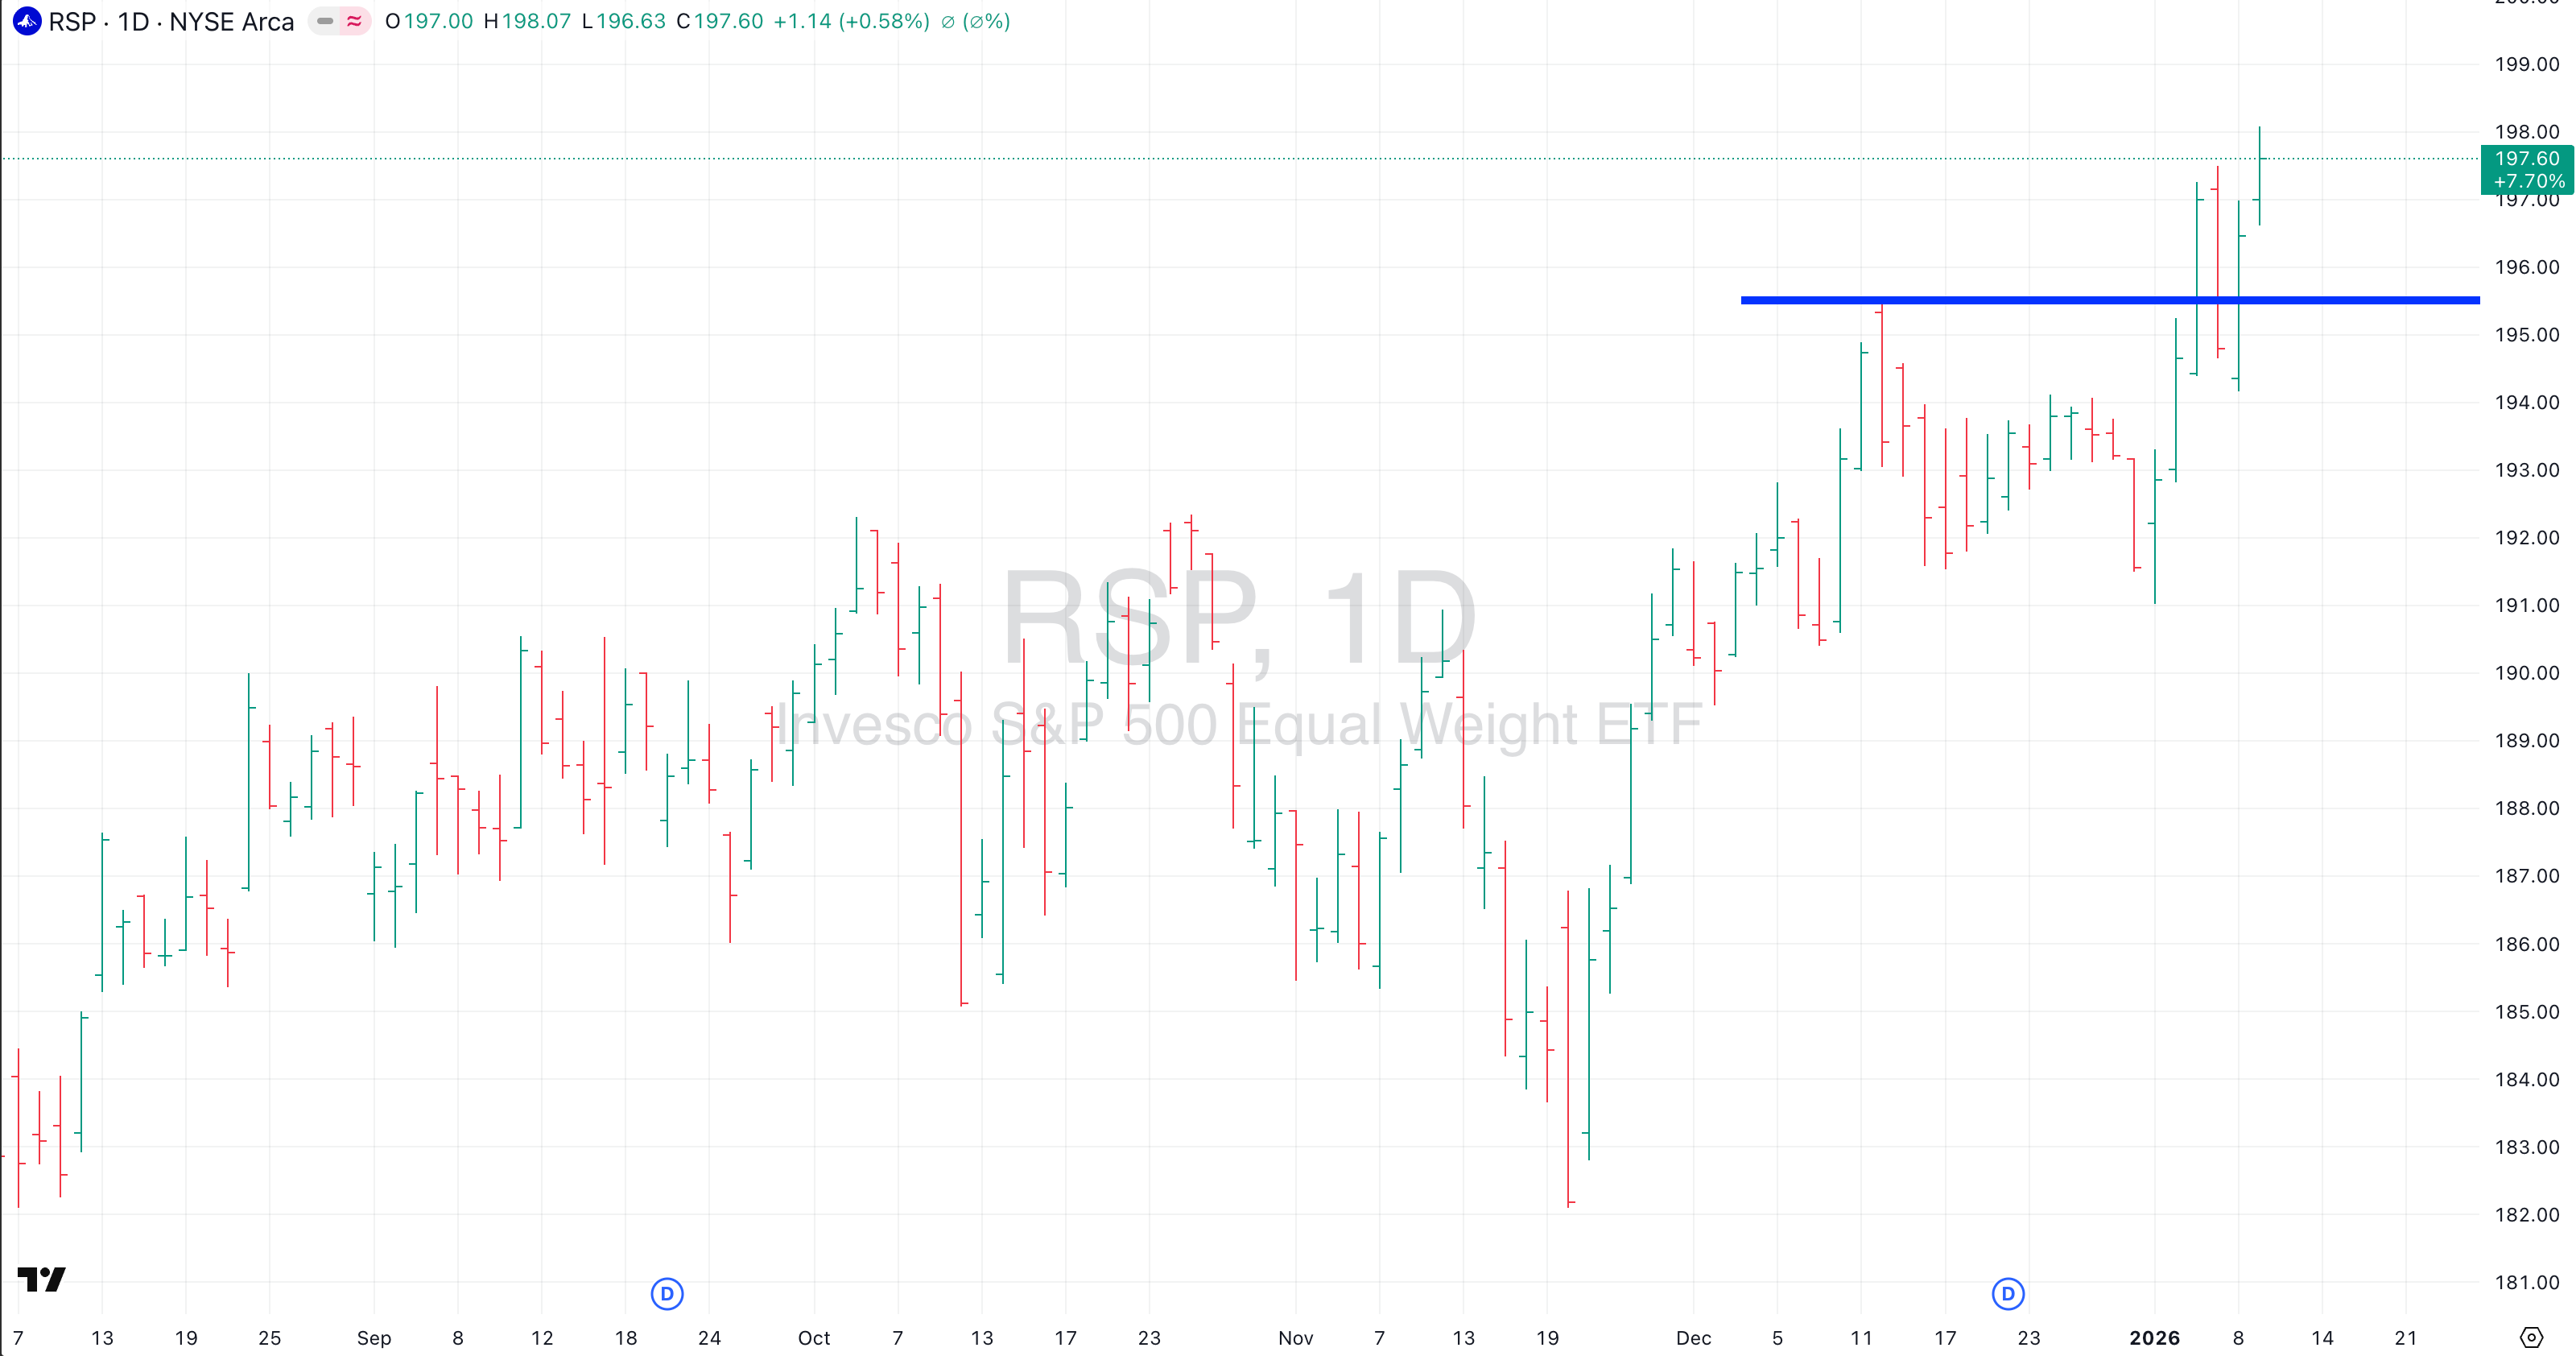
Last week (above) included non-U.S. charts, all of which are trending higher. Nvidia (NVDA) shows the gift and the curse of market cap-weighted indices. Great when the highest weightings force the indices higher. Not so great when they cause the broader market to lag relative to the equal-weight equivalents (QQQE) and (RSP):
NVDA Nvidia - Chopping around building the levels.
(QQQE) Nasdaq Equal Weight- On the breakout line while the Nasdaq market cap-weighted (QQQ) is still building up the levels (above).
RSP S&P Equal Weight- Broke out before the market cap-weighted (SPY) (above).
Disclaimer: Little Bird Trading and any of its associations may or may not, whether long or short, have a position in any instruments. Not investment advice. Provided for informational purposes only. Not a recommendation or endorsement. Not registered or licensed. Model portfolios are property of their respective owners. All data is sourced from publicly available information. No guarantee is being made or offered. Not responsible for financial loss or ruin.


